
Chart Echo
Chart Echo uses AI to match your current chart with historical patterns, showing how similar setups played out before.
Visit
About Chart Echo
Chart Echo is a specialized market analysis tool designed to reveal how current chart patterns have historically played out across stocks and cryptocurrencies. The core premise is that markets move in repeating patterns—bases, breakouts, blow-off tops, and capitulation lows—and that studying these historical precedents provides an honest, data-grounded perspective for decision-making. Instead of relying on indicators, scripts, or subjective analysis, Chart Echo takes the exact shape of the chart you are currently viewing and searches through approximately 450 million historical windows to find moments that closely resemble it. The tool then aggregates how those historical matches continued, presenting outcome statistics such as how often setups rose, fell, or went nowhere, the average move, and the typical drawdown. This is not a prediction system or financial advice; it is a pattern-matching engine that organizes the market’s own memory so traders, long-term investors, and crypto watchers can study precedent in seconds. The product is designed for clarity and simplicity, offering a guided five-step flow—from selecting a market to saving a workspace—that requires no configuration or custom models. Chart Echo is free to start with no account required, making it accessible for anyone curious about historical pattern behavior, while accounts unlock saved workspaces and premium features for more advanced analysis.
Features of Chart Echo
Historical Pattern Matching Engine
Chart Echo searches roughly 450 million historical windows across stocks and cryptocurrencies to find chart patterns that closely resemble the one you are currently viewing. The algorithm analyzes the shape, structure, and progression of candles to produce a ranked list of historical echoes, each with a similarity score and explanation of why it rhymes. This allows users to instantly see which past setups looked most like today’s pattern, providing a factual foundation for studying precedent rather than relying on intuition or anecdotal memory.
Outcome Statistics and Overlay
After identifying historical matches, Chart Echo shows you what happened next by aggregating the continuations of each match. You see clear statistics including the percentage of times the setup rose, fell, or went nowhere, the average move over the following days or weeks, and the typical drawdown along the way. Additionally, you can overlay any historical match directly onto your current chart in gold, visually comparing the pattern and its future path. This feature transforms raw data into actionable insight without requiring users to interpret complex charts manually.
Guided Five-Step Workflow
The app provides a structured, linear path from start to finish: select a market (stock or crypto), set the timeframe and pattern length, view ranked matches, overlay and study outcomes, then save or share. This eliminates the blank canvas problem common in complex trading tools. Each step is clearly labeled and intuitive, making the tool usable for both beginners and experienced analysts. The guided flow ensures that users always know what to do next and can focus on interpreting results rather than navigating a cluttered interface.
Save, Remind, and Share Tools
Chart Echo allows users to save their workspace for later review, set reminders to check for new fractals on a favorite chart, and receive notifications when a strong fractal projection prints. You can also generate shareable GIFs and images of your chart with overlaid historical matches to discuss with friends or colleagues. These features extend the tool’s utility beyond a single session, enabling ongoing monitoring and collaboration without requiring constant manual re-analysis.
Use Cases of Chart Echo
Active Trader Setup Validation
Before committing capital to a trade setup, an active trader can input the current chart pattern into Chart Echo to see how similar historical setups performed over the following weeks. The tool provides odds, average move, and typical drawdown, helping the trader assess risk-reward based on actual precedent rather than speculation. This use case is particularly valuable for day traders and swing traders who rely on pattern recognition and want to validate their thesis with historical data.
Long-Term Investor Sanity Check
A long-term investor monitoring a breakout or sell-off in a portfolio holding can use Chart Echo to check that move against decades of historical precedent. Instead of relying on a single analyst’s opinion or media narrative, the investor sees how similar patterns resolved across multiple timeframes and assets. This provides a data-driven frame for decisions about holding, adding to, or reducing a position, especially during volatile or uncertain market conditions.
Cryptocurrency Pattern Analysis
Crypto markets are known for strong pattern repetition, and Chart Echo is optimized to match BTC, ETH, and other major cryptocurrencies against their own past structures as well as across different assets. A crypto trader can quickly see if a current consolidation or breakout has historically led to continuation or reversal, helping navigate the high-volatility environment with more confidence. The tool’s cross-asset matching also reveals patterns that might not be obvious when looking at a single coin in isolation.
Educational and Collaborative Study
Traders and investors learning about chart patterns can use Chart Echo to study how specific formations—such as flags, wedges, or head-and-shoulders—have historically resolved across a wide range of markets. By generating and sharing GIFs or images of overlaid historical matches, users can discuss setups with peers or mentors, deepening their understanding of pattern behavior. This use case transforms the tool into a learning resource that bridges theoretical knowledge with real market data.
Frequently Asked Questions
What exactly does Chart Echo do?
Chart Echo takes the shape of the chart you are currently viewing and searches through approximately 450 million historical windows across stocks and cryptocurrencies to find moments that looked similar. It then shows you how those historical matches played out afterward, including outcome statistics like the percentage of times the setup rose or fell, the average move, and typical drawdown. It is a pattern-matching tool that organizes historical precedent for study, not a prediction system.
Is Chart Echo free to use?
Yes, Chart Echo is free to start with no account or signup required. You can immediately search for matches on any stock or crypto. Creating an account allows you to save workspaces for later review. Premium features, including Pro Mode, saved-setup reminders, intraday timeframes, alerts, and watermark-free exports, are available through a paid subscription.
Does Chart Echo provide financial advice or predictions?
No. Chart Echo explicitly states that it is not a prediction tool and does not offer financial advice. It provides historical precedent and outcome statistics based on past market behavior. The tool is designed to organize the market’s own memory so users can study precedent before making their own decisions. All trading or investment decisions remain the sole responsibility of the user.
How does the pattern matching algorithm work?
The algorithm analyzes the shape and structure of your current chart pattern, focusing on the progression of candles over a timeframe you define. It then searches its database of approximately 450 million historical windows to find patterns with similar geometric and structural characteristics. Matches are ranked by similarity, and each match includes an explanation of why it rhymes. The algorithm does not use traditional indicators or custom models; it is built specifically for pattern matching.
Similar to Chart Echo

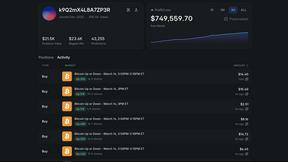
Polymarket Trading Bot For Crypto
Automate profitable 5-15 minute Bitcoin Up or Down trades on Polymarket using a transparent, reverse-engineered bot you run locally for full privacy.