LoadTester
LoadTester is a modern load testing tool for HTTP and API performance checks that runs distributed tests from your browser or CI/CD pipeline without.
Visit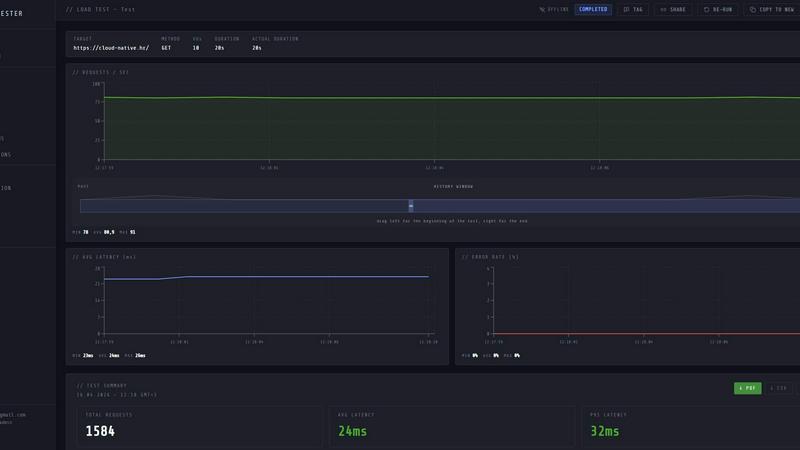
About LoadTester
LoadTester is a modern, cloud-native HTTP and API load testing tool designed by Cloud Native d.o.o. for engineering teams who need repeatable performance checks without the overhead of managing infrastructure. It enables developers, QA engineers, and site reliability engineers to create, execute, and monitor load tests directly from a browser or through CI/CD pipelines. The platform handles all the heavy lifting, including distributed worker scaling, cold starts in under three seconds, and real-time analytics. With LoadTester, users can simulate thousands of virtual users or requests per second against any HTTP endpoint, monitor live latency metrics like p50, p95, and p99, track error rates, and set intelligent thresholds that automatically stop tests when performance degrades. The tool is built for scale and reliability, supporting up to 10,000 virtual users and 10,000 requests per second per test. It includes features such as scheduled baseline tests, run-to-run comparisons, exports in PDF, CSV, and JSON formats, and integrations with Slack, email, and webhooks. LoadTester removes the painful parts of performance testing, allowing teams to catch regressions before users notice and ship with confidence. A free plan is available, making it accessible for small teams and individual developers who want simple, repeatable performance checks.
Features of LoadTester
Instant Execution and Distributed Workers
LoadTester launches distributed load tests in seconds without any infrastructure setup or worker orchestration. The platform auto-scales workers based on test requirements, with a cold start time of under three seconds from test creation to the first request. This means teams can focus on results and analysis rather than managing servers or scheduling headaches. The system handles queue management with zero millisecond wait times, ensuring tests start immediately.
Live Real-Time Analytics
While a test is running, LoadTester provides live streaming analytics that update continuously. Users can monitor throughput (RPS), latency distributions including p50, p95, and p99, active virtual users, and error counts in real time. The live charts display data within seconds, not minutes after the run, enabling immediate identification of performance bottlenecks or failures. This telemetry is essential for understanding application behavior under load as it happens.
Intelligent Auto-Stop and Thresholds
LoadTester allows users to set guardrails that automatically stop tests when performance degrades beyond acceptable limits. Users can configure thresholds for p95 latency, error rates, and regression compared to baseline runs. When a threshold is breached, the test auto-stops, preventing wasted resources and alerting the team immediately. Notifications can be sent via Slack, email, or webhooks to release bots, ensuring rapid response to performance issues.
CI/CD Integration and Automation
The platform is built for automation, supporting seamless integration into continuous integration and continuous deployment pipelines. Teams can run tests on every deploy, schedule nightly release gates, and trigger webhooks upon test completion. LoadTester provides API access for programmatic control, enabling workflow integrations that make performance checks repeatable and automated. This ensures that performance regressions are caught early in the development cycle.
Use Cases of LoadTester
Pre-Release Performance Validation
Engineering teams can use LoadTester to validate application performance before every production release. By running a suite of load tests against staging or canary environments, teams can catch regressions in latency, throughput, or error rates before they impact end users. Scheduled tests can run automatically as part of a release pipeline, with thresholds that fail the build if performance degrades beyond acceptable limits.
Capacity Planning and Spike Testing
LoadTester enables teams to simulate traffic spikes, such as flash sales, product launches, or seasonal events, to determine if their infrastructure can handle increased load. By configuring tests with high virtual user counts or request rates, teams can identify breaking points, measure how latency scales under pressure, and plan capacity upgrades accordingly. The live analytics help pinpoint which services or endpoints become bottlenecks first.
Baseline Monitoring and Regression Detection
Teams can establish performance baselines by running regular load tests against critical endpoints and comparing results over time. LoadTester’s run-to-run comparison feature highlights changes in key metrics like p95 latency, error rates, and throughput. If a new code deployment introduces a regression, the platform automatically detects the deviation and alerts the team, enabling proactive performance management.
API Contract and SLA Verification
For organizations that expose APIs to external partners or customers, LoadTester can verify that endpoints meet service-level agreements (SLAs) for latency and availability. By running tests with specific thresholds that mirror contractual obligations, teams can prove compliance and identify when API performance falls short. The exportable results in PDF, CSV, or JSON formats provide documentation for audits and stakeholder reviews.
Frequently Asked Questions
How do I start a load test with LoadTester?
Starting a load test is straightforward. From the dashboard, create a new test by providing a name, selecting the HTTP method (GET, POST, PUT, DELETE), entering the target URL, and choosing between virtual users (VUs) or requests per second (RPS) mode. Set the desired rate and duration, then click run. The test launches in seconds, and you can watch live analytics immediately.
What metrics are available during a live test?
LoadTester displays real-time metrics including requests per second (RPS), latency percentiles (p50, p95, p99), active virtual users, error counts, and success rate. A latency distribution chart shows how response times change over the last 60 seconds. After the test completes, a summary provides total requests, average latency, data sent, and data received.
Can I schedule tests to run automatically?
Yes, LoadTester supports scheduled tests that run at specified intervals, such as nightly or hourly. You can set up a test, configure a schedule (for example, daily at 02:00 UTC), and define thresholds for auto-stop and notifications. The platform will execute the test automatically and alert you via Slack, email, or webhook if thresholds are breached.
What integrations does LoadTester support?
LoadTester integrates with CI/CD pipelines, Slack, email, and webhooks. You can trigger tests from your deployment workflow, receive notifications on test results and threshold breaches, and post result links to release bots. The platform also provides API access for custom integrations and supports exporting results in PDF, CSV, and JSON formats.
Pricing of LoadTester
LoadTester offers a free plan that allows users to run basic load tests without any cost. For teams needing higher limits on virtual users, requests per second, concurrent tests, or advanced features like scheduled tests and API access, paid plans are available. Detailed pricing information, including specific tier names, costs, and feature breakdowns, can be found on the LoadTester website under the pricing section. Users are encouraged to visit the site to select a plan that matches their team’s scale and requirements.
Similar to LoadTester
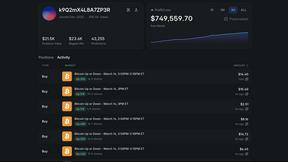
Polymarket Trading Bot For Crypto
Automate profitable 5-15 minute Bitcoin Up or Down trades on Polymarket using a transparent, reverse-engineered bot you run locally for full privacy.
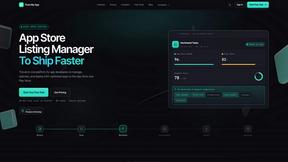
Push My App
Push My App generates optimized metadata and screenshots, scans for rejection risks, and submits directly to both app stores from one dashboard.